Visualizing the Call Option with a Simple Profit/Loss Chart
To make things clearer, let’s look at a simple profit-loss chart for both the buyer and seller of a call option. This helps show how each position behaves as the stock price changes. I have taken some screenshots from the trading app today. Let me also touch a bit on how to choose buy or sell put option from the Moomoo app.
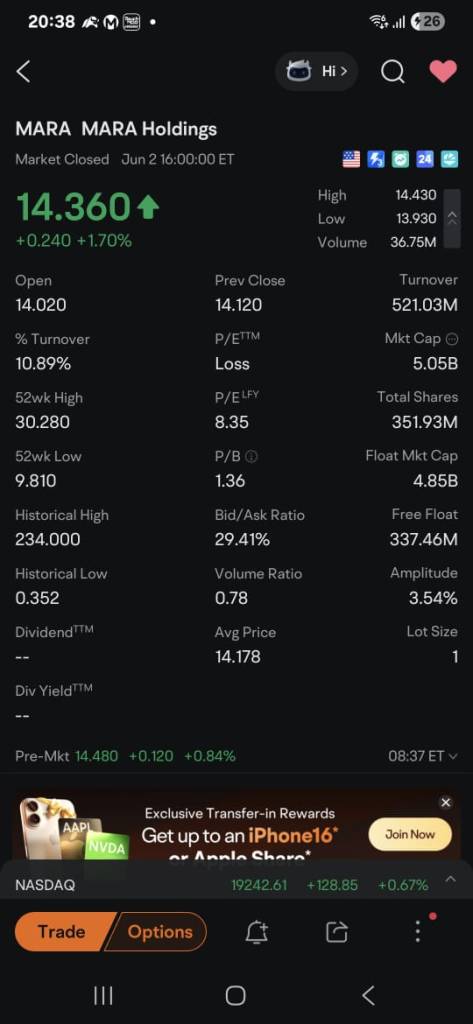
- First, search for the stock. I use MARA as an example here.
- Click on Option button at the bottom of the page. Click in call to focus only on the chain data for call option. [Screenshot 1]
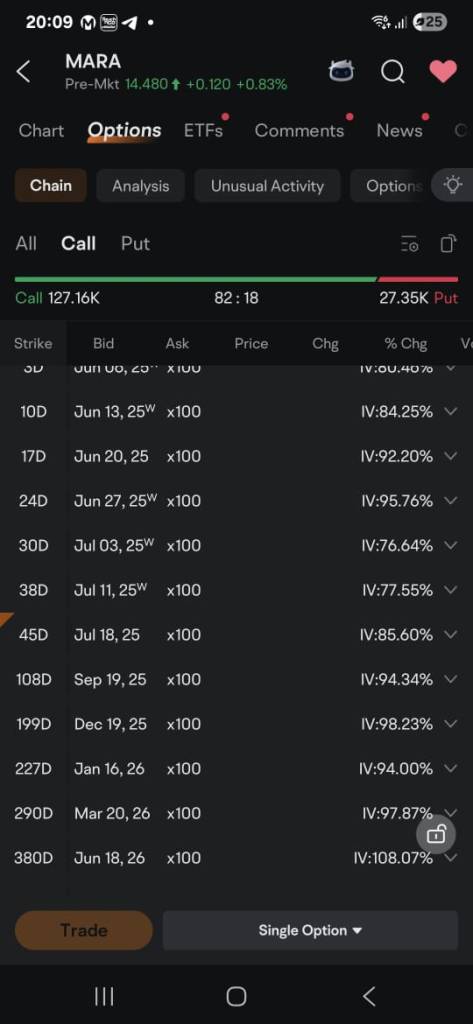
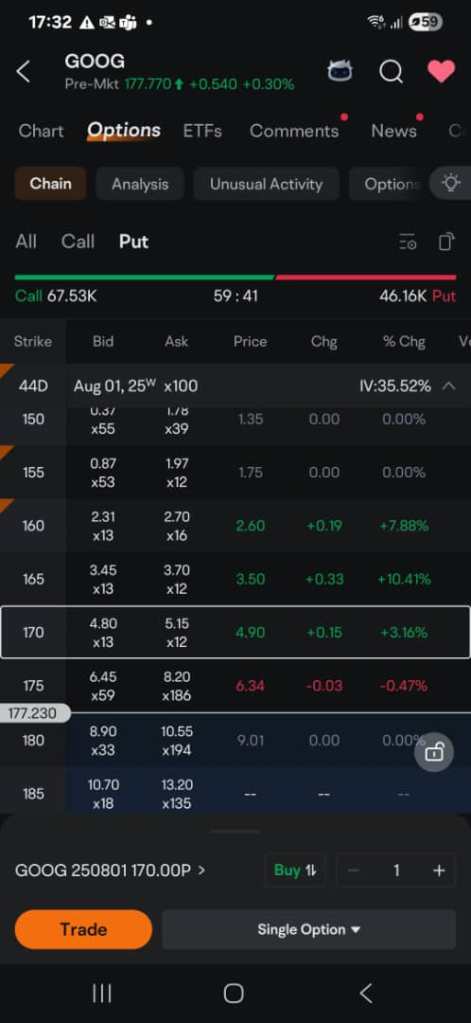
- Select the expiry date, I choose 44 days for this example.[Screenshot 2]
Note: for buyer, always choose expiry more than 30 days because the option price will usually drop fast when the contract has less than 30 days close to expiry - Buying a call option means you are bullish about the stock. Place the strike price near the current price ($177.23). I choose $170.00 as the strike price in this example.
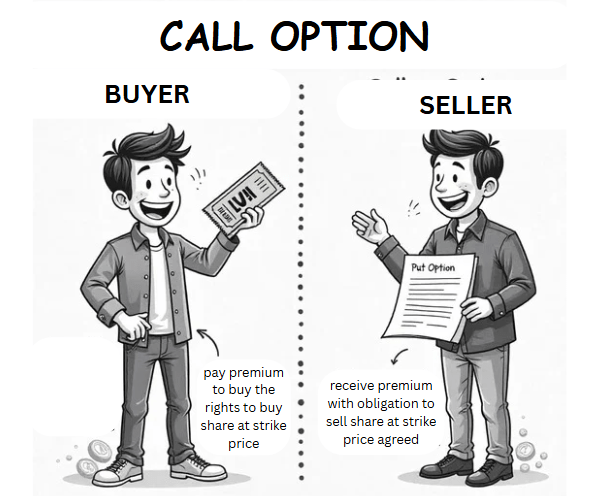
Note:- The buyer hopes the price will go up by expiry and he may exercise the option by buying 100 shares at the strike price, the profit can be unlimited depending on how high the share price can go.
- In case the price goes lower than the strike price, you will not want to buy the shares and you will loss the total premium you paid.
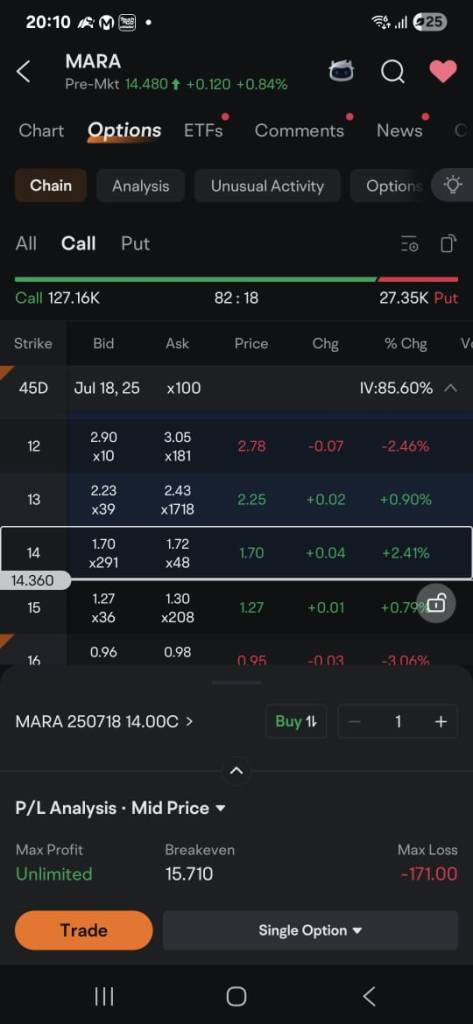
- Since you are the buyer, look for the ask price (the price seller is willing to offer to sell). [Screenshot 3]
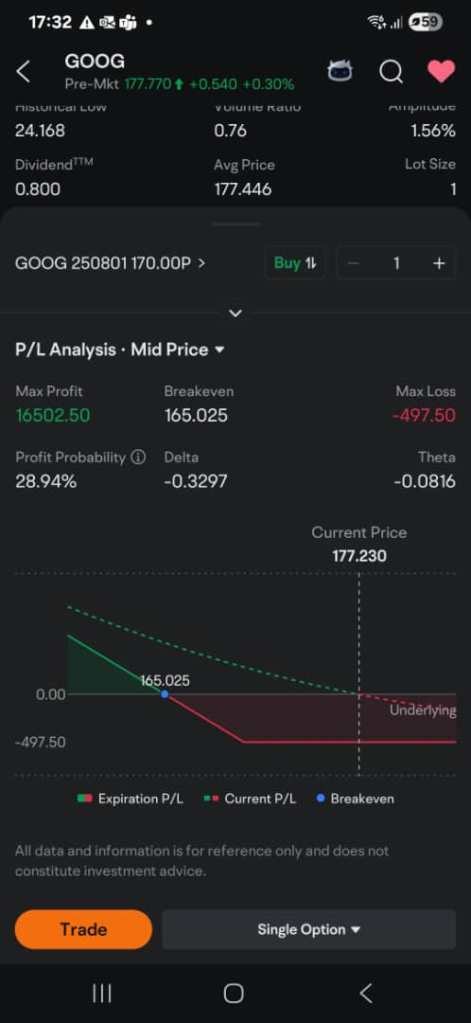
- Ask Price (or the mid price) shares $4.975 x 100 = $497.50 is the total premium you need to pay. This is the maximum loss for the buyer.


The seller at the same time is bullish about the stock, he receives premium from the buyer ($4.975 x 100 = $497.50 premium)
If the share price goes above the strike price, the buyer will not exercise his rights to sell shares. In this case, the premium will be the maximum profit made by the seller.
However, if the share price goes down and buyer wants to exercise his rights to sell share at the strike price, the seller needs to buy 100 shares at $170 per share to the buyer. The seller will have unlimited loss depending on how low the share price can go.
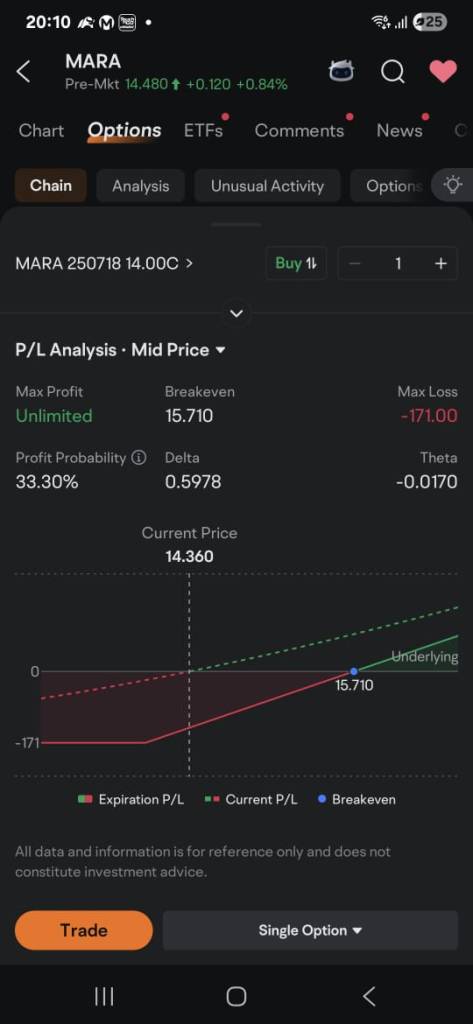
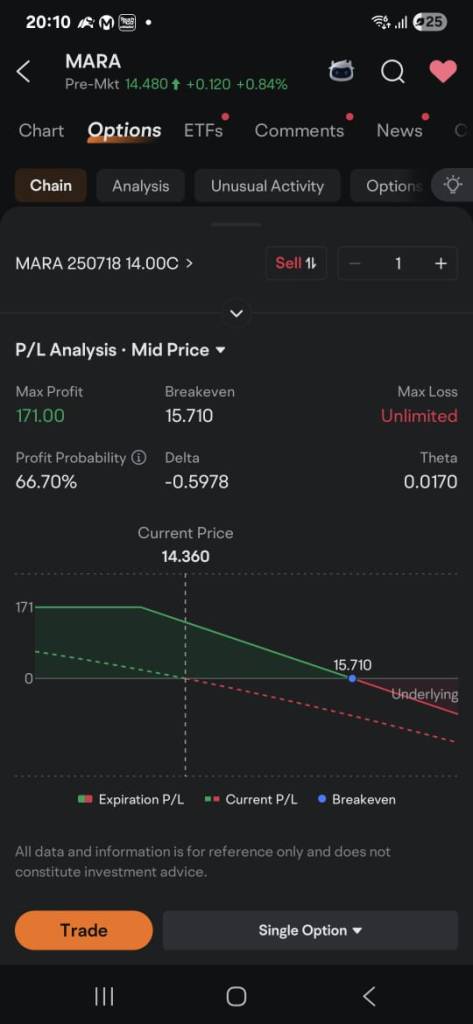
Below is the profit / loss chart for both the buyer and seller. They are exact opposites of each other. Take awhile to look at the max profit and max loss.
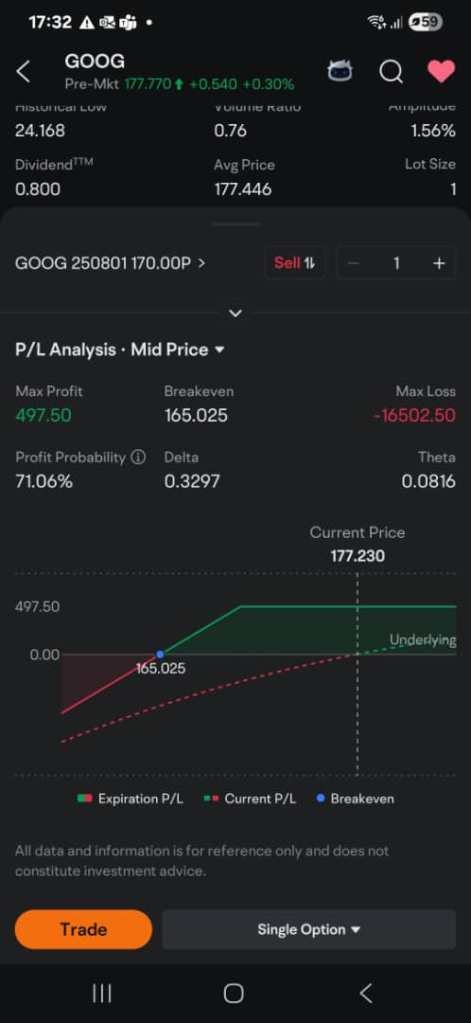
The breakeven:
The buyer don’t start making profit immediately when the share price goes a little below the strike price. Don’t forget about the premium paid ($4.975), this needs to be included in the profit/loss calculation. So, the buyer will only earn when the price goes lower than $170.00 (strike price) – $4.975 (premium) = $165.025. This is the breakeven.
The same breakeven is applicable to the seller in the opposite way because seller receives premium from the buyer. The seller will start losing when the share price goes below $165.025 (not when it goes lower than the strike price which us $170 in this case)