This month has been especially volatile, with two major market drops shaking things up.
Market Drops: What Caused Them?
Early August (around August 1): Market volatility was triggered by concerns over renewed U.S. tariffs and rate policy uncertainty. Historically, August is one of the weakest months for equities, with corrective stretches being common during this period.
Mid-August (around August 20): The tech-heavy Nasdaq experienced a sharp 2.2% decline over two days, driven by renewed fears about overexposure to AI. The sell-off was about weak earnings and the skepticism regarding the sustainability of tech megacaps’ valuations.Reuters
My Hedge Activity & Results
On August 20, 2025, in response to a cut-loss contract closure, I initiated additional trades to further reduce downside exposure.
Noticed the realisation of the premium increased fast during the quick drop of the underlying share. I close 3 sell call on the same day.
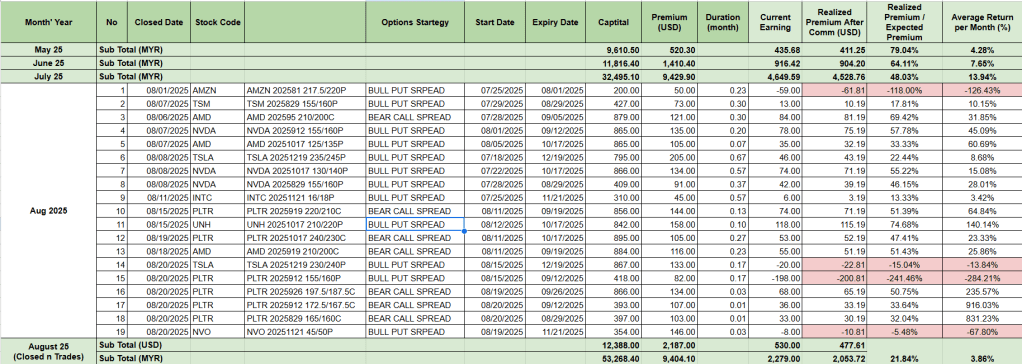
A quick summary on trades closed till the 3rd week of Aug’25:
19 trades closed till 3rd week of August’25
📝 Observations
Losses were contained – despite 2 forced cut-loss exits, overall win rate stayed strong at 84%.
Volatility management was key – sudden market drops forced earlier exits and additional hedging.
Short-duration spreads (some less than 5 days) worked well for quick profits (e.g., NVDA, PLTR).
Visualizing the Call Option with a Simple Profit/Loss Chart
To make things clearer, let’s look at a simple profit-loss chart for both the buyer and seller of a call option. This helps show how each position behaves as the stock price changes. I have taken some screenshots from the trading app today. Let me also touch a bit on how to choose buy or sell put option from the Moomoo app.
First, search for the stock. I use MARA as an example here.
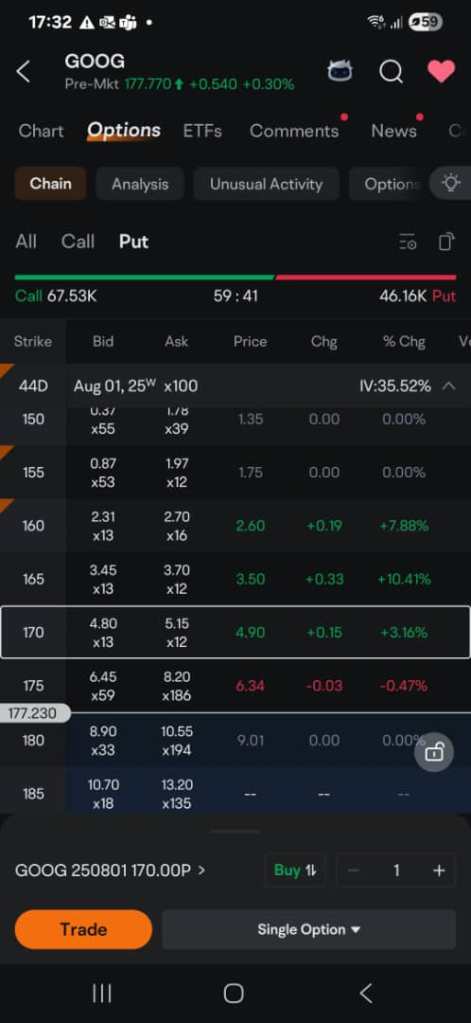
Click on Option button at the bottom of the page. Click in call to focus only on the chain data for call option. [Screenshot 1]
Select the expiry date, I choose 44 days for this example.[Screenshot 2] Note: for buyer, always choose expiry more than 30 days because the option price will usually drop fast when the contract has less than 30 days close to expiry
Buying a call option means you are bullish about the stock. Place the strike price near the current price ($177.23). I choose $170.00 as the strike price in this example. Note:
The buyer hopes the price will go up by expiry and he may exercise the option by buying 100 shares at the strike price, the profit can be unlimited depending on how high the share price can go.
In case the price goes lower than the strike price, you will not want to buy the shares and you will loss the total premium you paid.
Since you are the buyer, look for the ask price (the price seller is willing to offer to sell). [Screenshot 3]
Ask Price (or the mid price) shares $4.975 x 100 = $497.50 is the total premium you need to pay. This is the maximum loss for the buyer.
Screenshot 1
Screenshot 2
Screenshot 3
The seller at the same time is bullish about the stock, he receives premium from the buyer ($4.975 x 100 = $497.50 premium)
If the share price goes above the strike price, the buyer will not exercise his rights to sell shares. In this case, the premium will be the maximum profit made by the seller.
However, if the share price goes down and buyer wants to exercise his rights to sell share at the strike price, the seller needs to buy 100 shares at $170 per share to the buyer. The seller will have unlimited loss depending on how low the share price can go.
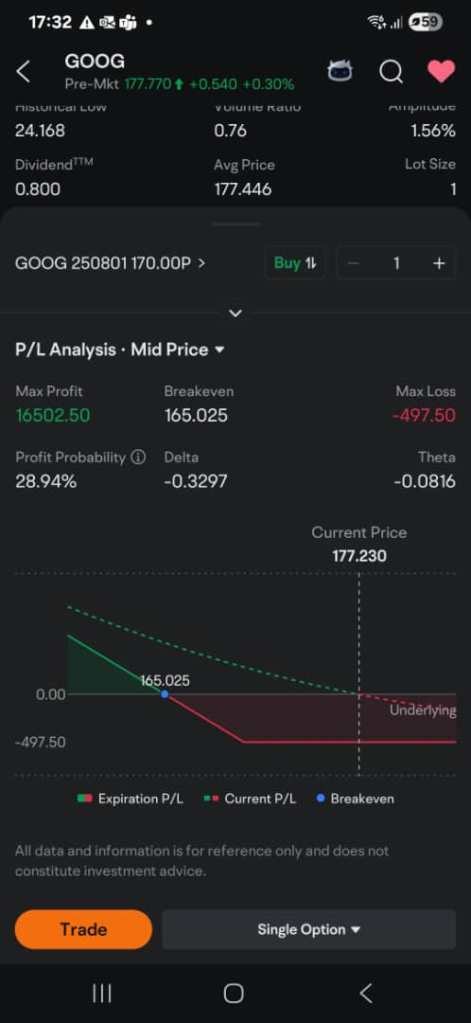
Below is the profit / loss chart for both the buyer and seller. They are exact opposites of each other. Take awhile to look at the max profit and max loss.
Buy Call
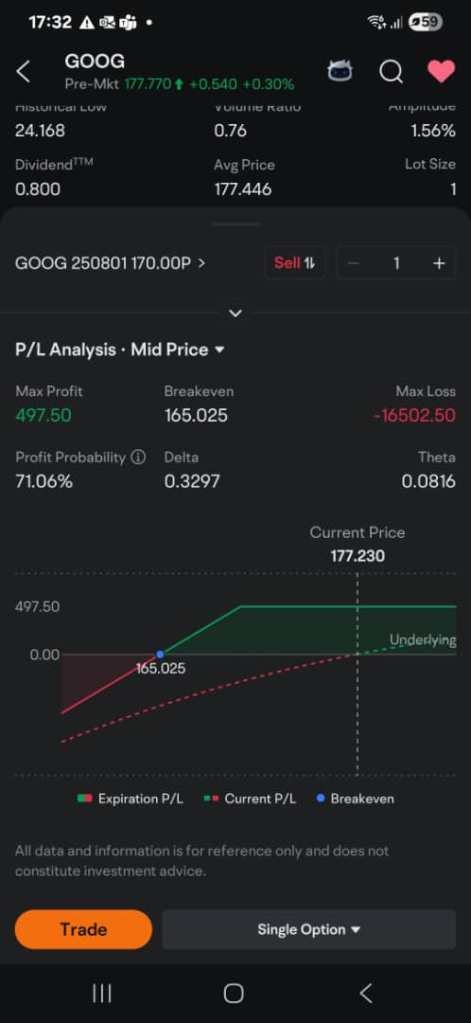
Sell Call
The breakeven:
The buyer don’t start making profit immediately when the share price goes a little below the strike price. Don’t forget about the premium paid ($4.975), this needs to be included in the profit/loss calculation. So, the buyer will only earn when the price goes lower than $170.00 (strike price) – $4.975 (premium) = $165.025. This is the breakeven.
The same breakeven is applicable to the seller in the opposite way because seller receives premium from the buyer. The seller will start losing when the share price goes below $165.025 (not when it goes lower than the strike price which us $170 in this case)
“Image generated using Freepik AI tools and used in accordance with Freepik’s free license terms.”
📈 What Is a Put Option?
From the buyer point of view:
A Put Option gives you the right to sell 100 shares of a stock at a specific price (the strike price) before the expiration date.
You pay a premium upfront for this right.
❌ If the stock price stays above the strike price, you just let the option expire. Your maximum loss is the premium you paid.
✅ If the stock price goes below the strike price, you can exercise the option — and sell your shares at the higher strike price, making a profit.
A Put Option Seller (also called a put writer) agrees to buy the stock at the strike price if the buyer chooses to exercise the option.
In exchange, the seller receives the premium — this is their maximum profit.
❗ If the stock price crashes, the seller might be forced to buy shares at a much higher strike price, even though the market price is much lower. In short, the seller earns limited reward (premium) but takes on higher risk if the trade moves against them.
RISK!!!
Selling naked put options is risky if you’re not ready to buy the stock.
DON’T EVER SELL NAKED PUT OPTIONS!!! “Naked” means you’re selling the option without holding the shares or cash to cover it.
📦 One Option = 100 Shares
Remember!!! When you enter 1 Option contract, it represents 100 shares of a stock. So if the premium is $2, it means you pay or receive $2 × 100 = $200 premium as the buyer or seller respectively.
🎟 Simple Example
Let’s say:
A stock is trading at $50
You buy a Put Option with a $50 strike price
You pay a $3 premium → total cost: $3 × 100 = $300
Now two things can happen, the stock price can go up or down:
📈 Stock Stays Above $50
Buyer won’t execute the option
Buyer Loss = $300 premium paid
Seller Profit = $300 premium collected — no shares bought
Seller Loss = Must buy stock at $50 while market price is $40 → ($10 loss − $3 premium received) × 100 = −$700 (If the seller intends to buy share at this low target price, he / she will not mind buying the share at the low price, just need to ensure that you are selling put options for fundamentally good company)
💡 Why Use Put Options?
Protects your stock from falling prices (like insurance)
Lets you short a stock (profit from drops) with limited risk
Sellers can earn income while waiting to buy stocks they like-> ✅✅✅✅✅I personally sell put option for this purpose.
Buyers can secure a selling price even if the market crashes
After some time exploring the world of options trading, I’ve decided to implement a structured routine that helps me trade consistently and improve gradually — without overtrading or getting emotional. My current goal is simple:
🎯 Close $100 in profit per week by buying options with staggered expiry dates — ensuring at least one contract expires each week.
I’ll be updating this blog every weekend with my trade summary and reflections — wins, losses, and lessons included.
Rules and Commitments for myself:
Staggered Expiry Dates Ensures I am not overexposed to one expiration week. It spreads out risk and keeps a consistent flow of activity.
Weekly Closing Goal Targeting $100 per week is realistic for small accounts (e.g., $2k–$5k capital). It forces discipline and avoid overtrading.
Routine Structure Having specific days for screening, buying, monitoring, and reviewing reduces emotional decision-making.
Built-in Reflection & Adjustment Weekly blogging/logging for self-review, for improving.
🛠 Tools I’m Using
Type
Tool Name
Usage Description
Charting & Analysis
ChartNexus
For technical analysis, drawing setups
Broker Platform
Moomoo App *Tiger Trade (for bot trading only)
For placing trades, reviewing option chains, and managing open positions
Trade Logging
Google Sheets
To log each trade’s entry/exit, profit/loss, notes, and track weekly performance (on Options only)
Reflection & Sharing
This Blog (running on WordPress)
To document weekly results, track progress, reflect strategy used
This routine is my attempt to turn trading into a weekly ‘business‘, not a random gamble. It’s a mix of structure, learning, and personal growth — and I’ll share everything I learn, whether it’s a win or a tough loss.
If you’re building a routine of your own, feel free to follow along or share your approach. Let’s grow together.
Until next weekend — Stay consistent. Stay curious. Trade small.
A friend sent me a screenshot of the WHEEL strategy yesterday. It reminds me to share this in blog.
Funny thing is, I had already thought of this approach on my own before realizing it was actually a real, practical strategy. I only found out its name and how it’s used after reading about it in a training material on the Moomoo app.
Today, I want to share what I’ve learned about the WHEEL strategy. The WHEEL strategy is a systematic options approach that involves two key actions:
Step-by-Step: How It Works
Step 1: Sell a Cash-Secured Put
I begin by choosing a stock I wouldn’t mind owning 100 shares of. Then I sell a put option at a strike price I’m comfortable buying at. I keep the premium upfront. For example, I sell 1 put option contract for Google for 2 months at strike price USD150.
If the stock price stays above the strike price by expiration, I keep the premium and repeat.
If the price drops below the strike, I buy 100 shares at the strike price (which I planned for).
NOTE: secured put means you need to own the money to buy the 100 shares in case the price dropped to the target price you set.
Step 2: Sell a Covered Call
Now that I own 100 shares bought at the very low price from Step 1, I sell a covered call at a higher strike price, i.e USD 200.
If the stock rises above the strike price, my shares are sold, and I keep the profit + premium.
If not, I still own the shares and can repeat the process of selling more calls for income.
And once the shares are sold, I go back to step 1: sell puts again. That’s why it’s called the “WHEEL” — it keeps turning.
Why I Like This Strategy
Simple to understand for non-professionals
Generates consistent premium income
Lets me accumulate stocks at discounted prices
Things to Keep in Mind
Choose high-quality stocks you don’t mind holding
Ensure you have enough capital to buy 100 shares if assigned
I’m currently trying to use this method in my own investing journey. It allows me to stay active in the market, collect income, and potentially accumulate stocks I believe in — all while following a simple, repeatable system.
At this stage, I am still collecting premium while waiting for the share price to drop to my target.
Have you tried the WHEEL strategy before? Let me know your experience or thoughts in the comments!
Visualizing the Call Option with a Simple Profit/Loss Chart
To make things clearer, let’s look at a simple profit-loss chart for both the buyer and seller of a call option. This helps show how each position behaves as the stock price changes. I have taken some screenshots from the trading app today. Let me also touch a bit on how to choose buy or sell put option from the Moomoo app.
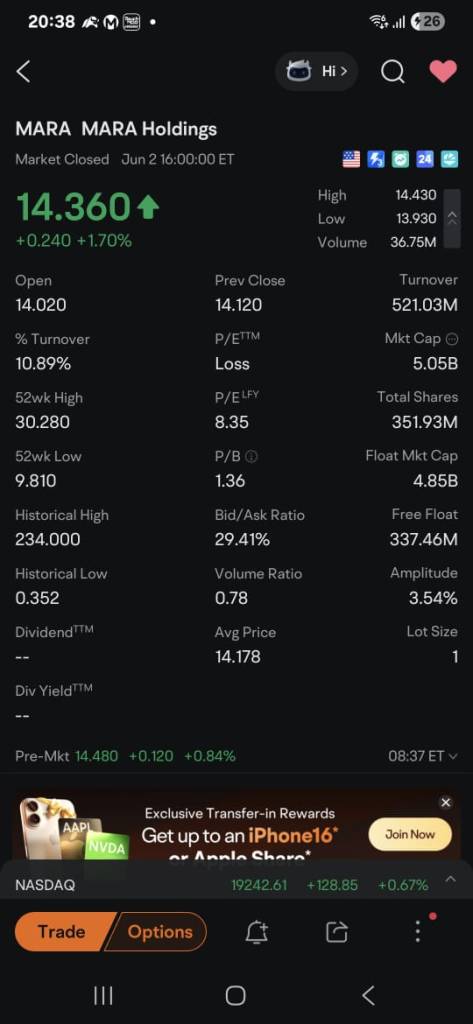
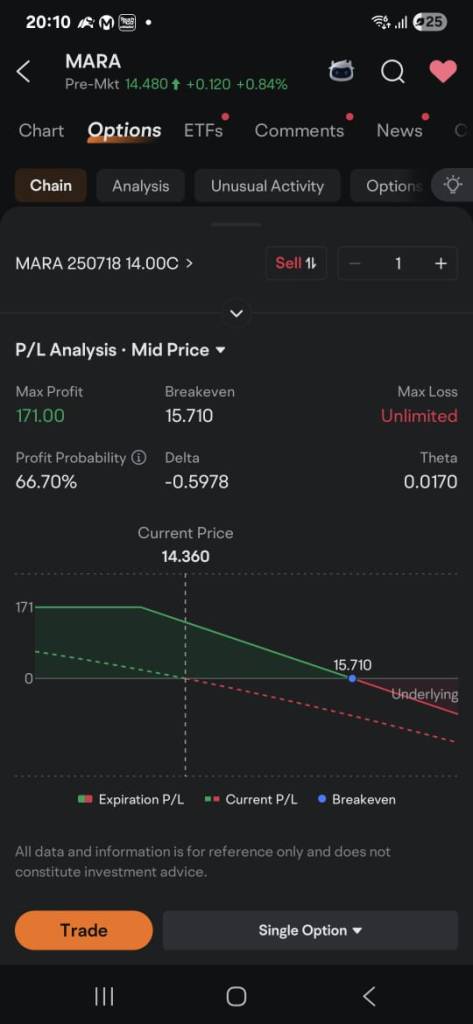
First, search for the stock. I use MARA as an example here.
Click on Option button at the bottom of the page. Click in call to focus only on the chain data for call option. [Screenshot 1]
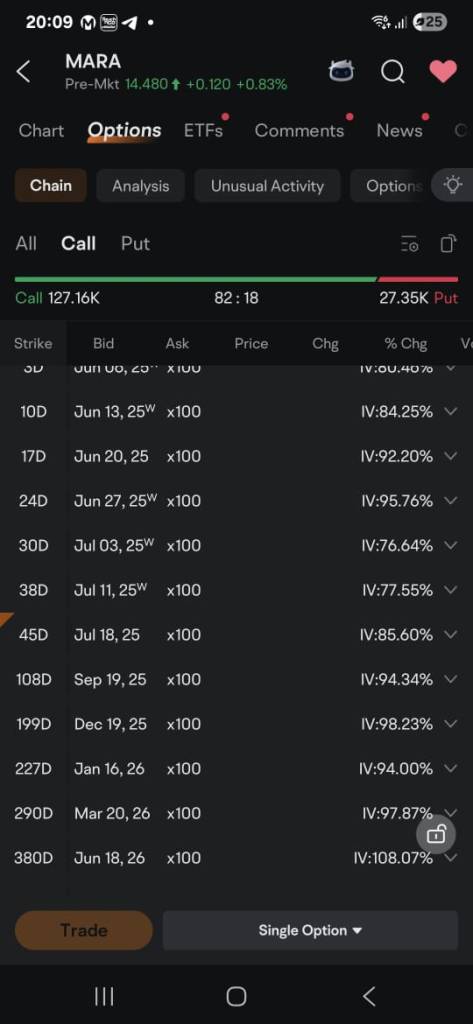
Select the expiry date, I choose 45 days for this example.[Screenshot 2] Note: for buyer, always choose expiry more than 30 days because the option price will usually drop fast when the contract has less than 30 days close to expiry
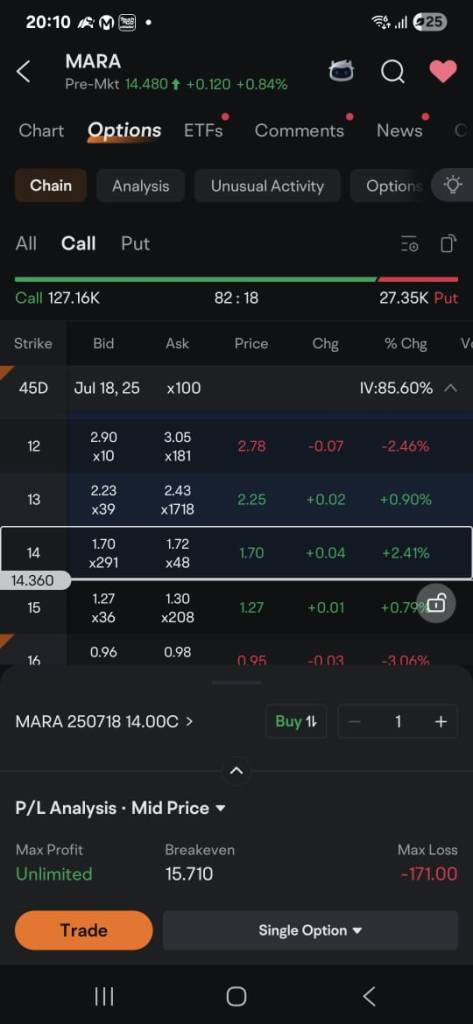
Buying a call option means you are bullish about the stock. Place the strike price near the current price ($14.36). I choose $14 as the strike price in this example. Note:
The buyer hopes the price will go up by expiry and he may exercise the option by buying 100 shares at the strike price, the profit can be unlimited depending on how high the share price can go.
In case the price goes lower than the strike price, you will not want to buy the shares and you will loss the total premium you paid.
Since you are the buyer, look for the ask price (the price seller is willing to offer to sell). [Screenshot 3]
Ask Price (or the mid price) $1.71 x 100 shares is the total premium you need to pay. This is the maximum loss for the buyer.
Screenshot 1
Screenshot 2
Screenshot 3
The seller at the same time is bearish about the stock, he receives premium from the buyer ($1.71 x 100 shares = $171 premium)
If the share price falls below the strike price, the buyer will not exercise his rights to buy shares. In this case, the premium will be the maximum profit made by the seller.
However, if the share price goes up and buyer wants to exercise his rights to buy share at the strike price, the seller needs to buy 100 shares at the market price and sell it at $14 per share to the buyer. The seller will have unlimited loss depending on how high the share price can go.
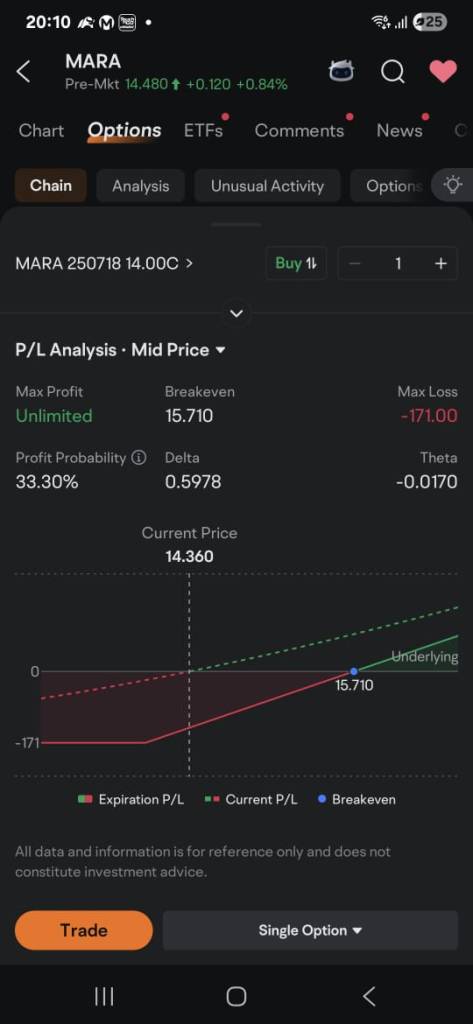
Below is the profit / loss chart for both the buyer and seller. They are exact opposites of each other. Take awhile to look at the max profit and max loss.
Buy Call
Sell Call
The breakeven:
The buyer don’t start making profit immediately when the share price goes a little above the strike price. Don’t forget about the premium paid ($1.17), this needs to be included in the profit/loss calculation. So, the buyer will only earn when the price goes higher than $14 (strike price) + $1.71 (premium) = $15.71. This is the breakeven.
The same breakeven is applicable to the seller in the opposite way because seller receives premium from the buyer. The seller will start losing when the share price goes below $15.71 (not when it goes lower than the strike price which us $14 in this case)
“Image generated using Freepik AI tools and used in accordance with Freepik’s free license terms.”
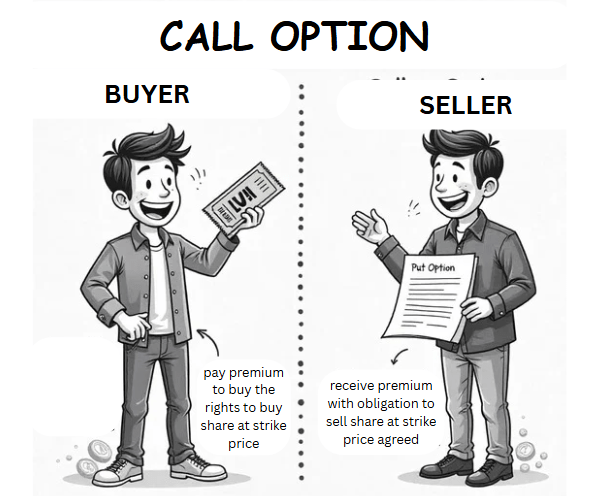
📈 What Is a Call Option?
From the buyer point of view:
A Call Optionis like a ticket that gives you the right to buy a stock at a certain price (called the strike price) before a specific date.
You pay a small fee upfront (called a premium) to get this right. You don’t have to buy the stock — it’s your choice.
When there is a buyer, there must be a seller. From the seller point of view:
A Call Option seller (also called the option writer) is like someone offering a deal — they agree to sell a stock at a fixed price (strike price) if the buyer decides to use their option.
In return for taking on this obligation, the seller gets paid a small fee upfront, called a premium. This premium is the seller’s immediate income — and also their maximum profit from the contract.
But there’s a RISK:
If the stock price goes way above the strike price, the buyer might exercise the option, to buy 100 shares from the seller at the lower strike price agreed earlier. The seller must then sell the stock at the strike price — facing a loss if they don’t already own the shares, they need to buy the 100 shares from the market based on the market price and sell it to the buyer at the lower strike price agreed earlier.
In short, the seller earns limited reward (premium) but takes on higher risk if the trade moves against them.
DON’T EVER SELL NAKED CALL OPTIONS!!! “Naked” means you’re selling the option without holding the shares or cash to cover it.
However, you can still earn from a SELL CALL if you have pre-owned the 100 shares since long time ago that were bought at a price lower than a strike price.
📦 One Option = 100 Shares
Remember!!! When you enter one Option contract, it represents 100 shares of a stock. So if the premium is $2, the real cost of the contract is $2 × 100 = $200.
🎟 Simple Example
Let’s say:
You think a stock will go up – when you buy a call option, it means you are bullish about a stock.
The current price is $50, you can buy a call option that lets you buy the stock at $50 in the future if the stock price goes up (before the contract expiry date).
You pay a $2 premium x 100 = $200 for this rights.
Now two things can happen, the stock price can go up or down:
📈 Stock goes up to $60
Buyer will execute the option to buy at $50, then sell at $60 Profit: ($10 – $2 premium) x 100 shares = $8 x 100 = $800
Seller will sell 100 shares at $50 to the buyer Loss: ($50-$60+$2 premium) x 100 shares = -$8 x 100 = -$800
📉 Stock stays below $50
Buyer will not execute the option Loss: $2 premium x 100 = $200 premium paid earlier
Seller no need to sell share to the buyer Profit: $200 premium paid earlier received from the buyer earlier
💡 Why Use Call Options?
You don’t need to invest in 100 shares right away — the option lets you wait and see. If the price goes down, your only loss is the premium you paid, and you’re not required to buy the shares.
In the next post, I’ll explain the other type of option — the Put Option, which is about the right to sell instead of buy.
“Image generated using Freepik AI tools and used in accordance with Freepik’s free license terms.”
The word “option” means a choice — and that’s exactly what options trading is about.
The buyer pays for the right to make a choice later (to buy or sell a stock), while the seller agrees to fulfill whatever the buyer chooses — in return for a fee upfront called premium.
It’s Just Like Buying Insurance
Think of it this way:
When you buy insurance, you pay a premium to the insurance company. You might never make a claim, but if something bad happens, you can exercise your right and claim compensation.
The maximum loss for the buyer is the premium paid
The potential gain happens if the buyer decides to exercise the right at a profitable time.
For the seller (like the insurance company):
They receive the premium upfront, and that’s their maximum profit.
But if the buyer exercises their right (like claiming insurance), the seller has to cover the cost, which could be much more than the premium received.
Buyer of Option = Insurance Holder
Pays a premium
Has the right to buy/sell the stock
Limited loss (just the premium), but unlimited potential gain
Seller of Option = Insurance Company
Gets the premium upfront
Has the obligation to buy/sell the stock if buyer chooses
Limited gain (only the premium), but potential for large losses
📄 All Terms Are Written in a Contract
Just like an insurance policy, every option trade is defined by a contract. This contract includes:
The premium (the price the buyer pays)
The strike price (the fixed price at which the buyer can buy or sell the stock)
The expiry date (the deadline by which the buyer must decide)
Once the contract expires, the choice goes away. If the buyer doesn’t take action before then, the seller keeps the premium and nothing more happens.
There are two types of Options, i.e. Call (right to buy) and Put (right to sell). In my next post, and how traders use them to manage risk or generate income — just like how insurance works in everyday life.
I’m still new to investing — at least to what I’d call proper investing.
Previously, my so-called “strategy” was really just guesswork. I’d buy well-known stocks or look at random share price charts, by buying when the price dropped a lot and avoiding anything at an all-time high. No real plan. No structure. Just instincts.
That changed after I read a few books that opened my eyes to the many strategies out there — from capital gain plays to dividend-focused stocks to quant-style trading. Those books gave me a glimpse of what serious investing could look like, and that’s when I decided to treat this journey more seriously.
I also had a nudge from a friend who encouraged me to dedicate some time to investing and trading outside of my full-time job. That’s how we ended up spending a few mornings each week in a Family Mart, digging into strategies and trying to build a portfolio from scratch.
We didn’t manage to finish that portfolio — at least not the way we initially planned. Instead, we decided to get a head start by trying K2Robot trading by ChartNexus on the Tiger platform. It was a faster way to get our feet wet while continuing to learn. Each of us invested about 10k MYR (total up 4,6k USD into Tiger Plarform for a start in Mar2025).
Then came the Outlook 2025 event by Piranha Profits. I joined mainly because my friend invited me, but I left with a whole new level of motivation. One speaker in particular really caught my attention — a Vietnamese options trader who shared his story of going from extreme hardship after the war to becoming a multi-million-dollar options trader. His story, along with the appeal of high leverage in options trading compared to stocks, inspired me to sign up for an options trading course. I paid about USD 1,8k for the course and the journey started.
I’ll be honest — I couldn’t wait to start. Even before finishing the course, I jumped into options trading and made my first few trades. With the help of the learning materials available in Moomoo Trading App, I started to get a better grasp of how options trading works and began to understand a few key strategies. Slowly, things started to click — from basic calls and puts to more structured strategies, like vertical spread a start.
In my next post, I’ll share the details of the first three options contracts I bought [My First 3 Options Trade] — and how they turned out.